Core API: Two Functions, Two REST APIs
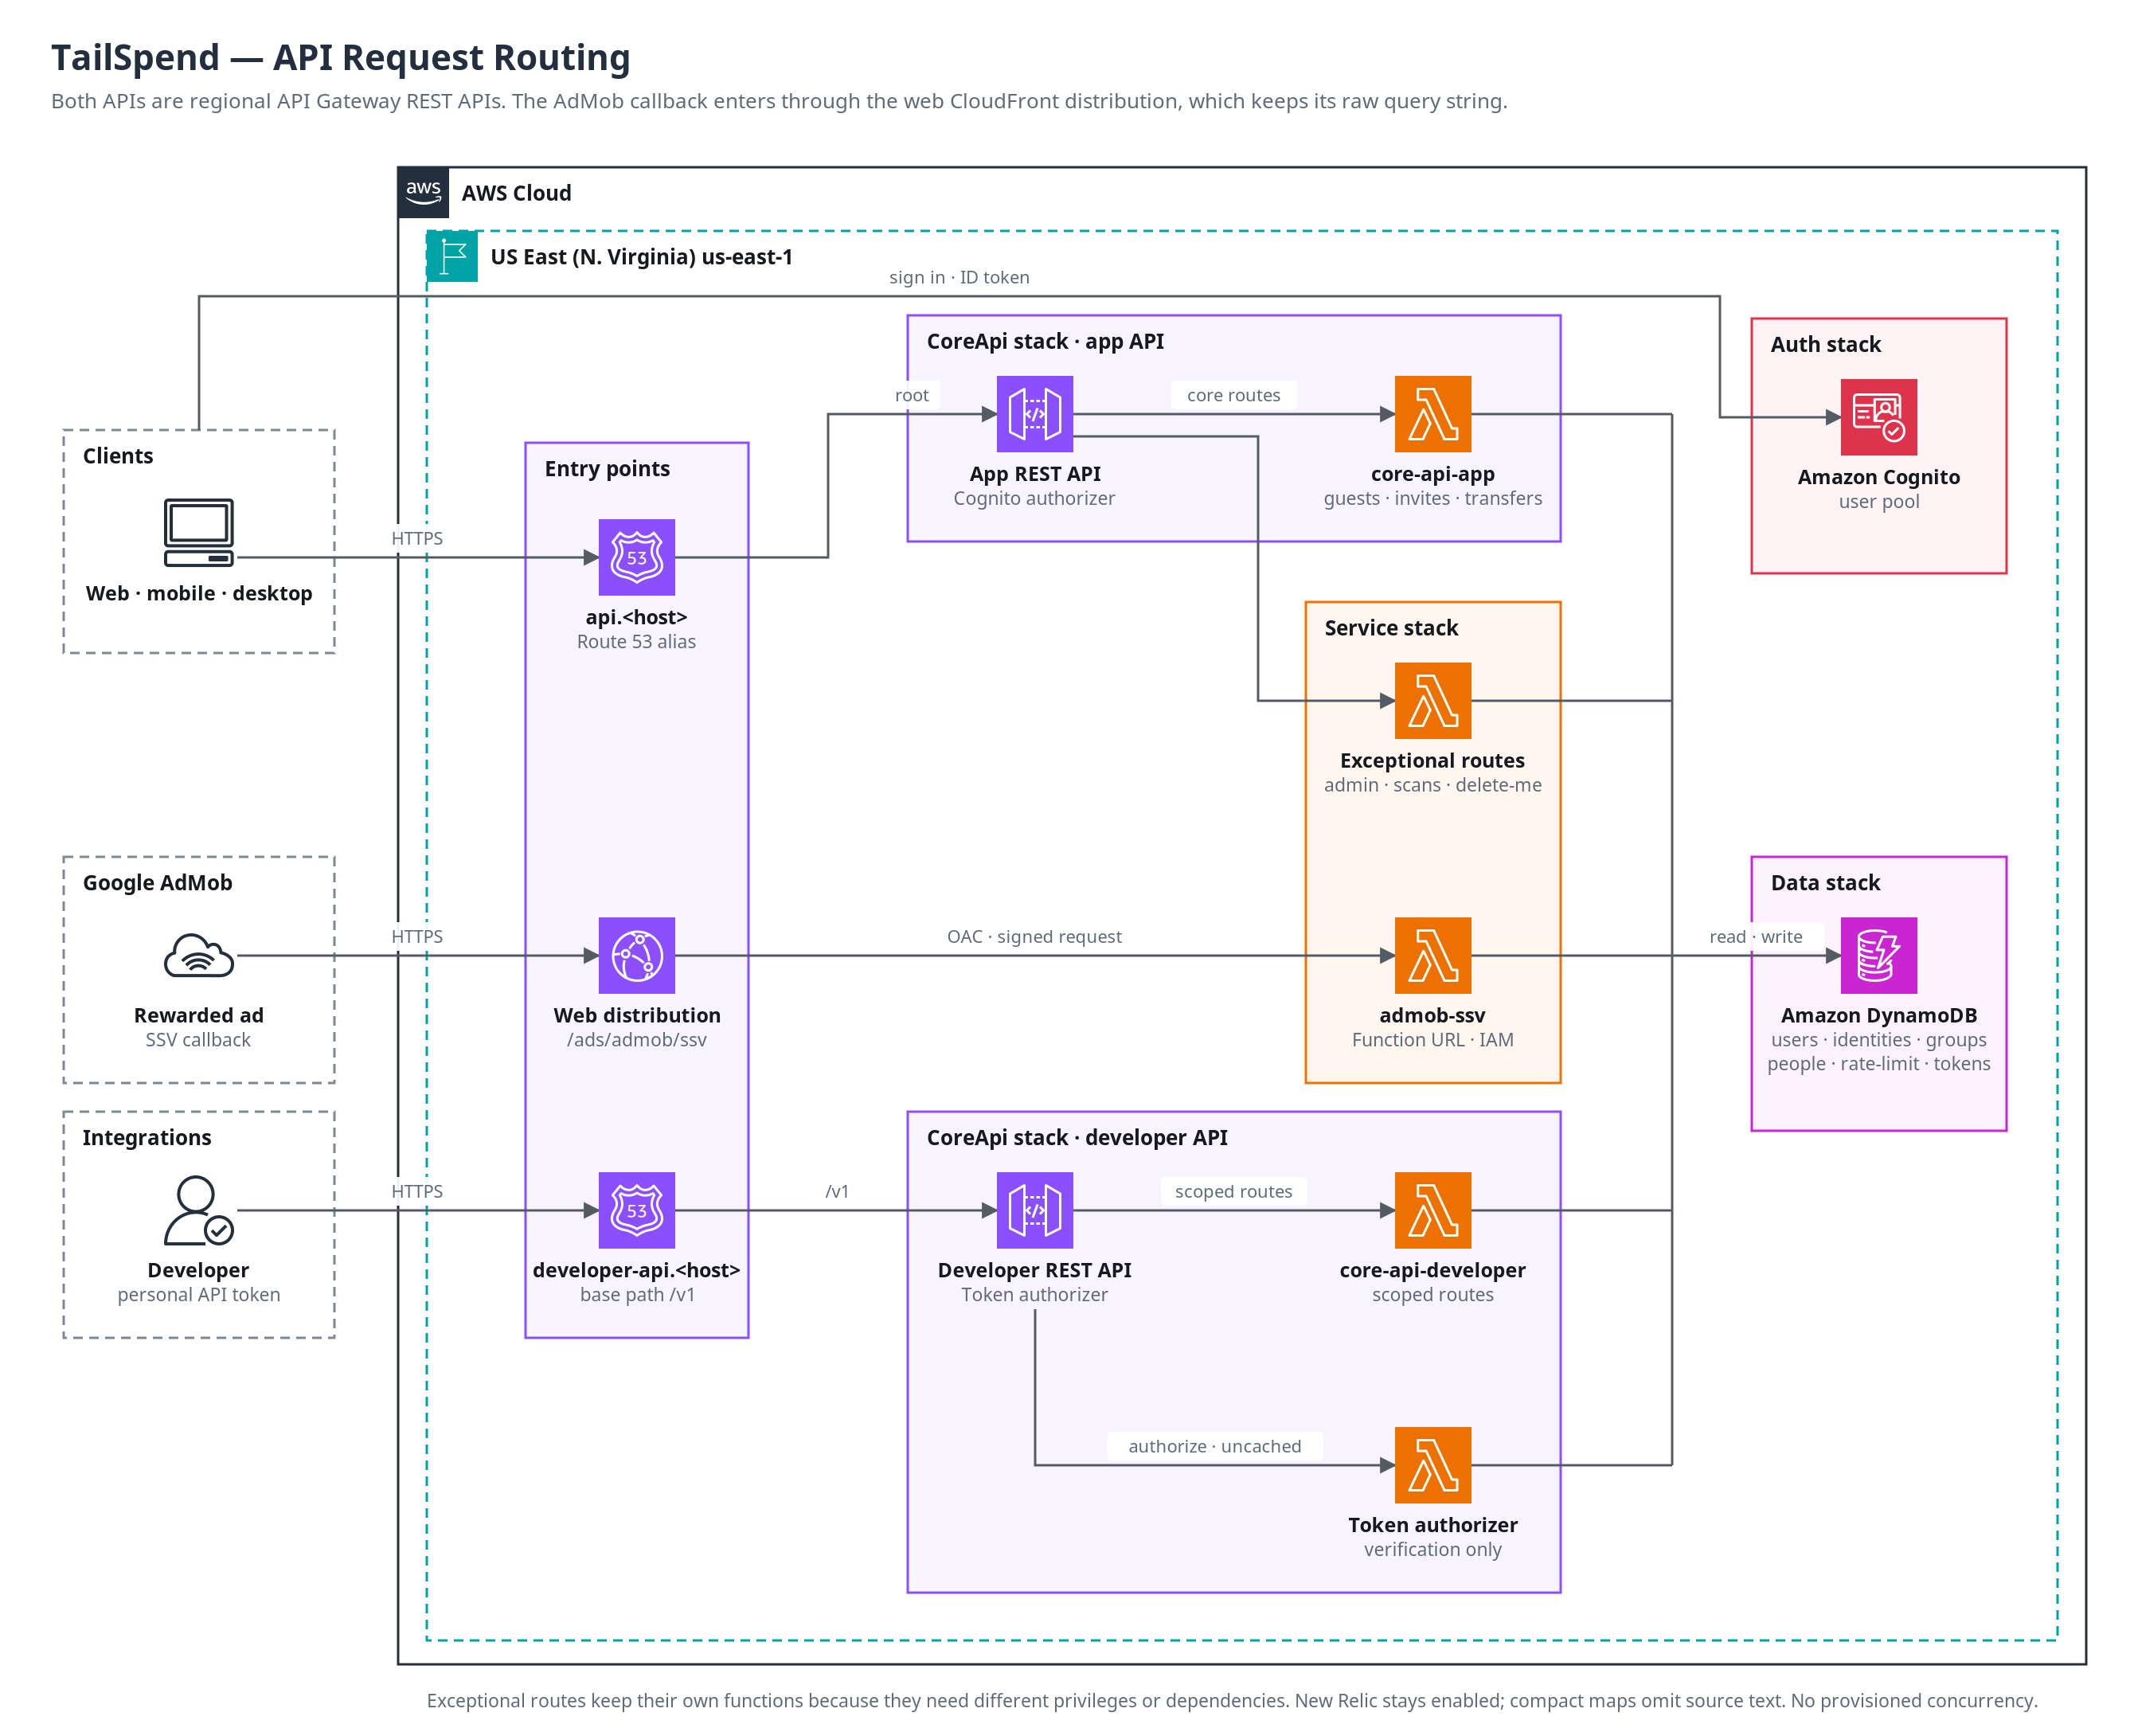
Issue #632 consolidates TailSpend's request/response API from one Lambda per route into two core API functions that run the same router and application code:
| App core API | Developer core API | |
|---|---|---|
| Gateway | App REST API (api.<stage> after cutover) |
Developer REST API (developer-api.<stage>…/v1) |
| Authentication | Cognito user-pool authorizer (ID tokens) + accepted-client check in the router | Personal-token Lambda authorizer (no caching) |
| Function | tailspend-<stage>-core-api-app |
tailspend-<stage>-core-api-developer |
| Routes | Every app route except the exceptional ones | DEVELOPER_ROUTE_SCOPES only |
| Concurrency | Reserved (guaranteed and capped) | Independent ceiling |
| Limits | 120 weighted units/min per user | 60/min per user across tokens, 30/min per token, 500 creates/day |
The personal-token authorizer (tailspend-<stage>-developer-token-authorizer) is a third, separate function. The exceptional routes keep their own functions, because they need materially different privileges or dependencies: admin, receipt scanning, account deletion, and the AdMob SSV callback. The scan worker, the reconciler and the recurring-expense tick are unchanged.
Where Things Live
| Concern | Location |
|---|---|
| Route manifest (exceptional, HTTP-only, developer scopes, starting limits) | packages/api-schema/src/core-api.ts |
| Shared router | apps/services/src/core/router.ts |
| Route tables | apps/services/src/core/app-routes.ts, developer-routes.ts |
| Entry points | apps/services/src/core/app-handler.ts, developer-handler.ts |
| REST ↔ HTTP event adapter | apps/services/src/runtime/api-event.ts |
| Principal model | apps/services/src/runtime/principal.ts |
| Tokens, idempotency, usage | apps/services/src/developer/ |
| Stacks | apps/infra/lib/stacks/core-api-stack.ts, service-stack.ts (cutover) |
| Per-stage policy (cutover flag, concurrency, throttles) | apps/infra/lib/config/core-api.ts |
Every operation is still written as a per-route withHandler(...) handler. Those handlers expose their validated operation, and the router dispatches to it. Validation, membership and role checks, ownership rules, persisted creator attribution, optimistic version checks, pagination and error envelopes are therefore byte-for-byte the code that ran before. The route tables are checked against the OpenAPI document in app-routes.test.ts, and CDK synth cross-checks the manifest (validateCoreApiRoutes).
Request Path
For each request the router:
- Checks gateway identity. It serves only REST events whose
apiIdequals the function's configuredCORE_API_GATEWAY_ID. - Checks the route allowlist. The gateway's matched route template must be in the deployment's table; unknown routes return 404. The developer router refuses to start if any route lacks a scope.
- Builds the principal. It reads only verified authorizer output, never a header or body field:
- App: a Cognito ID token whose
audis a TailSpend client (web, mobile, integration tests), or anonymous on the explicitly public invite reads. - Developer: the token authorizer's context.
- Token context at the app entry point, or Cognito claims at the developer one, is a 401.
- App: a Cognito ID token whose
- Applies token restrictions (developer only): the route's scope, the path's group in the token's groups, and a strongly consistent membership check. The check confirms the base-table participant row, and denies whenever the membership index and that row disagree. Removing someone from a group, or changing their role, therefore takes effect on their next request.
- Applies limits (see below).
- Runs the shared operation.
- Records one usage aggregate, bounded to 250 ms (see below).
Request-scoped state (event, principal, logger) never leaves the invocation. Only clients and immutable configuration are reused across warm invocations.
Route Registries
REST_ROUTE_AUTH and REST_ROUTE_GRANTS contain every OpenAPI route. Synthesis rejects missing or extra entries. EXCEPTIONAL_ROUTE_HANDLERS in apps/infra/lib/rest-route-handlers.ts contains only the eight EXCEPTIONAL_ROUTES, with exact subset validation and a check that each still exists in OpenAPI. Core operations import their handlers directly in services/src/core/app-routes.ts. The stale documentation-only handlers/index.ts is removed.
The canonical internal event is payload v2. REST proxy payload v1 is adapted once at entry by runtime/api-event.ts; the AdMob Function URL supplies v2 natively so its signed raw query string survives unchanged.
Authentication Notes
- ID tokens only. The HTTP API's JWT authorizer accepted ID and access tokens from the three app clients. A REST Cognito authorizer validates ID tokens unless a method requires OAuth scopes, and then it accepts only access tokens. Every shipping client (web, desktop, mobile) sends ID tokens, so the app REST API accepts ID tokens. The router keeps the audience allowlist, which the REST authorizer does not enforce. The integration suite now signs in with ID tokens as well.
- Validate the
Bearerprefix in beta. Clients sendAuthorization: Bearer <idToken>, and the REST Cognito authorizer is documented to accept the token in the header. The REST-target integration run in beta is the check that it accepts theBearerprefix; do not cut over a stage whose REST run is red. - Admin group claim.
cognito:groupscan arrive comma-joined from the REST authorizer;runtime/admin.tsaccepts commas, spaces and brackets.
Limits and Capacity
All allowances are initial policies to tune from measurements. They are set in CORE_API_RATE_LIMITS (@repo/api-schema), and can be overridden per function through APP_RATE_LIMIT_UNITS_PER_MINUTE, DEVELOPER_USER_RATE_LIMIT_UNITS_PER_MINUTE and DEVELOPER_TOKEN_RATE_LIMIT_UNITS_PER_MINUTE.
| Budget | Key in tailspend-<stage>-rate-limit |
Default |
|---|---|---|
| App, per user | RL#<cognito sub>#<minute> (unchanged) |
120 units/min |
| Developer, per user across all tokens | RL#DEV#USER#<userId>#<minute> |
60 units/min |
| Developer, per token | RL#DEV#TOKEN#<tokenId>#<minute> |
30 units/min |
| Developer expense creates | QUOTA#DEV_EXPENSE_CREATE#…#<day> |
500/user/day, 20,000/day overall |
The daily create allowance is charged inside the create operation, only after the body, the Idempotency-Key and the expense itself (payments fund items, splits) validate, and only once per key: the charge is recorded on the idempotency claim, so matching replays, retries after a crash and rejected requests are never charged twice or skipped. If the allowance refuses, nothing is recorded and the same key can be retried once capacity returns.
Weights are unchanged:
PATCH /users/me60,POST /groups30, group lists and balances 10, everything else 1 (runtime/request-weight.ts).The developer budgets use different keys from the app budget, so exhausting them never consumes the same user's app allowance. Extra tokens never multiply a user's allowance, because the per-user key is shared by all of their tokens.
429s carry
Retry-Afterwhen the limit resets:- the seconds left in the minute window for per-minute limits;
- the seconds until the next UTC midnight for daily allowances (developer creates, scans, uploads);
- 1 second for gateway throttles.
Limits with no near reset (a group's lifetime expense budget, an oversize request) send no
Retry-After; retrying won't help.Clients should wait at least
Retry-After, then back off exponentially with jitter on repeats.Bounds:
- request bodies: 256 KiB on the app API, 64 KiB on the developer API;
- collection sizes and page sizes: the existing schema and pagination caps;
- each group's lifetime expense allowance (1,000) still applies.
Gateway Throttles and Concurrency
These values live in apps/infra/lib/config/core-api.ts.
| dev | beta | prod | |
|---|---|---|---|
| App stage throttle (rps/burst) | 30/60 | 30/60 | 30/60 |
| Developer stage throttle | 10/20 | 10/20 | 10/20 |
| App core reserved concurrency | 5 | 5 | 20 |
| Developer core concurrency ceiling | 5 | 5 | 5 |
| Token authorizer concurrency | 5 | 5 | 5 |
The app API keeps the HTTP API's per-route throttles: scans 2/5, public invite reads 5/10.
Derive concurrency from measurements: concurrency ≈ peak RPS × p99 duration (s), with 2× headroom. All stages share one AWS account, which must keep at least 100 unreserved executions. Check aws lambda get-account-settings before raising any reservation.
Separate concurrency does not isolate shared resources:
- DynamoDB capacity:
maxWriteRequestUnits200 per table. - API Gateway's regional account quota.
Watch these metrics:
DeveloperCoreApiRequestsandDeveloperQuotaDenials;- the tables' throttle alarms in
MonitoringStack; - the Users table's consumed capacity, since usage aggregates add one write per request.
Usage Aggregates
Usage history reuses the Users table, with one row per day and sort-key namespace:
| Record | UserId |
SK |
|---|---|---|
| Daily developer-token usage | <ownerUserId> |
USAGE#DEVELOPER#DAY#YYYY-MM-DD#TOKEN#<tokenId> |
| Daily app usage | <userId> |
USAGE#APP#DAY#YYYY-MM-DD |
Each row carries these counters: RequestCount, SuccessCount, RedirectCount, ClientErrorCount (including 429s), ServerErrorCount, RateLimitedCount (the 429 subset) and AdmittedUnits. It also carries ExpiresAt, set to the end of the UTC day plus 90 days.
- One write per tracked request: an atomic
UpdateItemwithADDcounters andif_not_exists(ExpiresAt). There is no read-modify-write, no growing maps, and no per-request rows. Developer user totals are summed on read; no user-total or monthly rows exist. - What is tracked: every response the router returns to an authenticated principal, including validation and business errors and limiter rejections. Anonymous requests are not tracked. Neither are rejections by the gateway or the authorizer (bad or missing token, throttles), which never reach the router; those stay in the access logs and the
DeveloperTokenDenialsand*QuotaDenialsmetrics. AdmittedUnitscounts the route weight only when every limit passed. It is informational and is not the live limiter's balance.- Approximate counts. Atomic increments are not idempotent, so a retried write can overcount, and a failed or timed-out write leaves a gap. Tracking never changes a response and never bypasses a limit; failures are logged as
api_usage.record_failed(metric*UsageRecordFailures). This is not billing-grade accounting. - Reads (
GET /users/me/api-usage) query only the caller's partition by sort-key range:- The range is at most 90 days, within the last 90 UTC days. That cutoff is enforced in code, because TTL deletion is asynchronous.
- Every page is read; if the page budget runs out, the response sets
complete: falseand withholds totals. - Missing days are zero-filled only after successful reads.
- With three tokens used daily, 90 days is at most 270 small rows. Reads grow with the number of tokens used.
- Isolation from existing data:
- Usage rows never set
RecoveryStateorRecoveryDueAt, so they stay out ofScanRecoveryIndex. - Profile, balance and ledger reads are keyed (
PROFILE,BALANCE, andbegins_with(SK, …)ledger queries), so these rows don't affect them. - Account deletion sweeps the whole partition, usage included.
- Usage rows never set
- App usage is tracked only after the cutover. Before cutover, app traffic runs on the per-route functions, which don't record usage.
Cost Estimate
The estimate assumes US East (N. Virginia) on-demand pricing of $0.625 per million standard write units, items under 1 KB, and one aggregate write per request.
| Requests per user per day (1,000 users) | Monthly tracked requests | Added write cost |
|---|---|---|
| 10 | 300,000 | ~$0.19 |
| 100 | 3 million | ~$1.88 |
| 1,000 | 30 million | ~$18.75 |
Plan on $5–$10/month for 1,000 moderately active users as a conservative incremental estimate. This covers writes, the additional on-demand dashboard reads, and slightly longer Lambda execution. It is not an upper bound. Validate it against measured item sizes and latency, as described under Performance Baseline.
Observability
Logs. Each request in a core function logs one
core.requestline with:entryPoint;- the matched
routetemplate, orunmatched; authKind,status,durationMsandusageRecorded.
Core functions log at
infoon every stage. Find a route's latency with Logs Insights, for example:filter event = "core.request" | stats pct(durationMs, 95) by route.Metrics. Metric namespace
TailSpend/<stage>; the metrics have no dimensions, so their number is fixed:AppCoreApiRequests,AppCoreApiDurationMs,AppCoreApiServerErrors,AppUsageRecordFailures;- the
Developer…equivalents; QuotaDenials(fed by both the HTTP and REST access logs),DeveloperQuotaDenialsandDeveloperTokenDenials.
User and token ids are never metric dimensions.
New Relic (#631). Transactions are named
<entryPoint> <METHOD> <route template>, or<entryPoint> unmatched, and never contain concrete ids. They carry theentryPoint,route,authKind,stageandreleaseattributes. Monitoring stays optional: with New Relic disabled every call is a no-op.Token authorizer. Correlate it through the REST access log:
tokenIdis the authorizer principal, alongsideauthorizerErrorandauthorizerLatency. Gateway rejections do not appear in core Lambda traces.Credentials are never logged. That covers authorization headers, token secrets and idempotency keys (stored only as SHA-256).
AdMob SSV Callback
The AdMob server-side-verification callback verifies Google's signature over the raw query string, which REST proxy events don't carry. To retire the HTTP API it is served from the web distribution instead:
https://<web host>/ads/admob/ssv(stack outputAdmobSsvCallbackUrlon the Web stack) → CloudFront → the SSV Lambda's IAM-auth function URL. The function URL is never public: CloudFront signs every request with Origin Access Control, and the Lambda's resource policy allows only that distribution, for bothlambda:InvokeFunctionUrland URL-scopedlambda:InvokeFunction.- No caching, query strings forwarded untouched, so the function-URL event's
rawQueryStringis exactly what Google signed. - Edge guard: a CloudFront Function answers
400to anything that isn't aGETwithsignatureandkey_id, so junk never reaches Lambda. No WAF. - The distribution rewrites only
404s to the SPA'sindex.html(it may list its bucket, so missing objects are 404s, not 403s). An SSV failure therefore reaches AdMob as a failure and is retried rather than masked as200.
The AdMob console's SSV callback URL is the Web stack's AdmobSsvCallbackUrl output (https://<web host>/ads/admob/ssv).
Migration History
The HTTP API (one Lambda per route) was replaced in stages, all through the normal pipeline:
- Both APIs ran side by side while the integration suite ran against each target; promotion waited on both.
- A per-stage
REST_CUTOVERflag repointed each stage's rootapi.<stage>mapping at the REST API in place (same CloudFormation resource, so the host was never unmapped) and removed the superseded per-route functions. Dev and beta first, then prod. - The AdMob SSV callback moved to the web distribution (see above), and the HTTP API, its JWT authorizer, the
adsmapping and the cutover flag were removed. The root mapping keeps the HTTP API's former construct path, and so its logical id, so the removal didn't replace it.
Rollback is now an ordinary revert-and-redeploy: there is no second API to switch back to.
Performance Baseline
Do not assume consolidation reduces latency: one larger bundle can cold-start slower, while fewer, warmer functions cold-start less often. Before and after each stage's cutover, record:
- cold-start frequency and
InitDuration(CloudWatch Logs Insights on theREPORTlines); - end-to-end p95 and p99 (
IntegrationLatencyin the access logs, and*CoreApiDurationMs); - bundle sizes (CDK synth prints them; the app core bundle is about 670 KB minified, the developer one about 615 KB, the authorizer about 530 KB);
- the extra time spent on usage recording (
durationMswith and without tracking, plususageRecorded); - New Relic cold-start counts and dependency spans, with monitoring enabled.
Measured: 11–12 October 2026
The core functions' log groups were recreated during the cutover, so the window is about 13.5 hours: 2026-10-11 10:00 to 23:42 UTC. Nearly all traffic is the pipeline's integration and E2E suites. New Relic was on in beta and prod for the whole window. Method: Logs Insights over the REPORT lines (count, ispresent(@initDuration), avg/pct of @initDuration, @duration, @billedDuration, max(@maxMemoryUsed)), ConcurrentExecutions and Throttles (hourly maxima over 7 days) and API Gateway Latency/IntegrationLatency percentiles.
| Function (1024 MB; authorizer 256 MB) | Invocations | Cold | Init avg / p95 / p99 (ms) | Duration avg / p95 / p99 (ms) | Billed p99 (ms) | Max memory | Peak concurrency / reserved |
|---|---|---|---|---|---|---|---|
| prod app core | 3,408 | 44 (1.3%) | 1,529 / 1,720 / 1,723 | 61 / 162 / 278 | 1,612 | 240 MB | 11 / 20 |
| prod developer core | 1,125 | 14 (1.2%) | 1,505 / 1,750 / 1,750 | 60 / 149 / 317 | 1,640 | 255 MB | 2 / 5 |
| prod token authorizer | 1,149 | 14 (1.2%) | 1,482 / 1,648 / 1,648 | 59 / 131 / 715 | 2,017 | 165 MB | 2 / 5 |
| beta app core | 3,566 | 26 (0.7%) | 1,442 / 1,708 / 1,721 | 57 / 149 / 247 | 289 | 231 MB | 5 / 5 |
| beta developer core | 1,200 | 12 (1.0%) | 1,519 / 1,708 / 1,708 | 58 / 142 / 343 | 477 | 257 MB | 3 / 5 |
| beta token authorizer | 1,224 | 14 (1.1%) | 1,441 / 1,621 / 1,621 | 55 / 101 / 730 | 2,007 | 168 MB | 3 / 5 |
No throttles on any core function in the 7 days.
API Gateway, 7 days (p50 / p95 / p99, ms):
| API | Latency |
IntegrationLatency |
|---|---|---|
| prod App | 73 / 234 / 2,525 | 55 / 226 / 2,534 |
| prod Developer | 96 / 220 / 1,985 | 53 / 149 / 1,735 |
| beta App | 68 / 211 / 2,369 | 52 / 197 / 2,388 |
The p99s are cold starts: about 1% of invocations pay a ~1.5 s init, which the warm p95 (~150–230 ms) hides.
Usage recording. Its time can't be separated from the request: durationMs covers the whole request, and requests without tracking (anonymous, 169 in prod) are different work, so comparing the two groups says nothing. Recording is bounded by the 250 ms timeout. There were no api_usage.record_failed events in prod. Prod core.request, tracked requests: cognito 3,239 (avg 49 ms, p95 121, p99 229), token 1,125 (avg 46, p95 117, p99 286).
Tracing overhead. The core functions have had New Relic since they were created, so there's no before/after for them. Like-for-like on beta's other functions, New Relic roughly doubles init (~650 ms to ~1,580 ms) and adds about 60 ms to warm invocations (avg billed 145 to 208 ms). Details are on #633.
Tuning:
- Beta app core reached its reserved concurrency of 5 during a pipeline run without throttling. Raise it to 10 if beta suites grow or start to see 429s or 500s from throttling.
- Prod app core peaked at 11 of 20, so it has 2× headroom at current load. Keep 20.
- Developer core and authorizer peaked at 2–3 of 5. Keep 5.
- Memory: peak use is 230–260 MB of 1024 MB. Don't lower it to save cost: Lambda CPU scales with memory, and the init time (mostly New Relic plus the bundle) would grow.
- Cold starts: at ~1% of requests these are the biggest p99 cost. If p99 matters for real users, cut init time (New Relic's slim layer is already in use) before adding concurrency. Provisioned concurrency is ruled out on cost.
Re-measure once real user traffic dominates the suites.
Cold-start reduction (#690, 21 October 2026)
Separating the remaining startup costs
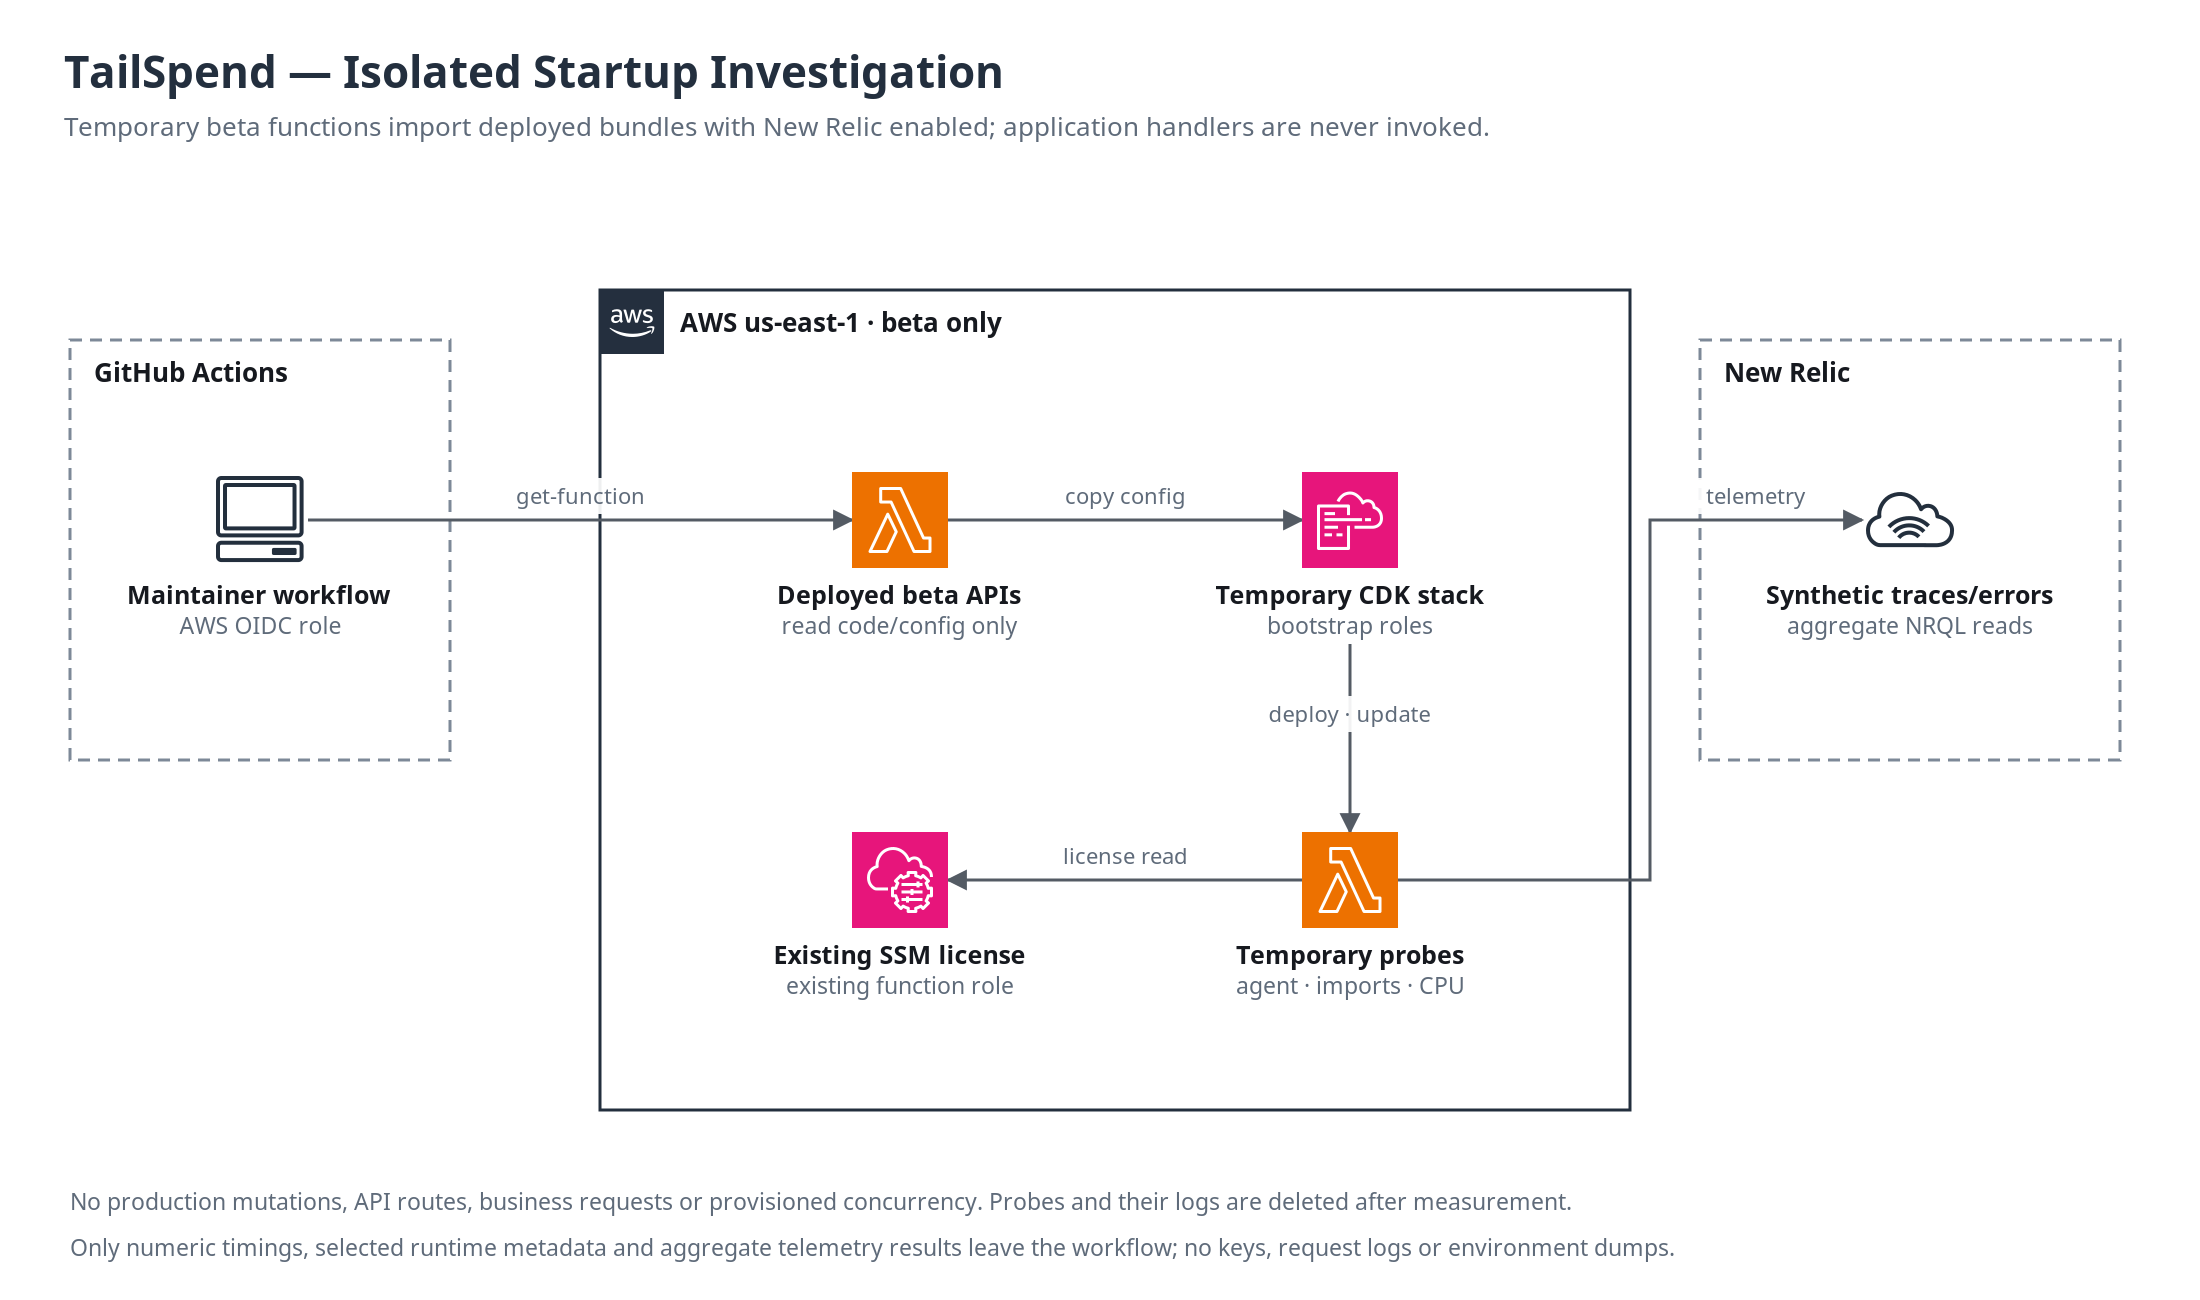
API Startup Investigation creates probe resources only on manual dispatch.
Maintainer-authored same-repository PRs changing its code run only aggregate
read-only New Relic and CloudWatch observations. It creates three fresh beta cold starts per cell: core app/developer at 1024/1769 MB and the token authorizer at
256/512/1024 MB. Every probe retains the deployed ARM64 runtime, New Relic layer,
dedicated ESM wrapper and SSM license-key lookup. An added preload observes the
agent's existing CommonJS entry compilation without loading the agent early;
the synthetic handler imports the deployed bundle but never calls its handler.
Three synthetic invocations allow telemetry to flush. One reports a fixed,
source-mapped synthetic error on the temporary function only.
The report includes Lambda InitDuration, agent initialization wall/CPU time, application import wall/CPU time, extension initialization from its own logs, and the extension's startup-to-license-obtained interval. The latter is an upper bound on the license phase, including Rust/AWS-client setup; it does not isolate the SSM network request. Agent/extension intervals are not a proven disjoint partition, so their times must not be mechanically added. These small, interleaved samples compare allocations; they do not establish production end-to-end p99. The workflow also collects a 24-hour pre-update and up-to-six-hour post-update production REPORT window, because the original one-hour pre-update window was empty. Traffic composition and cold-start counts must accompany any comparison. Source hashes and layer versions make the comparison reviewable.
The workflow also queries aggregate production invocation counts through the existing New Relic query credential, if configured, and looks for the synthetic mapped probe errors. A successful configuration check alone does not demonstrate ingestion. No production request is induced for this check.
Source inspection of the pinned Rust extension v2.7.1
(commit e785bad)
shows one SSM license-key fetch, in parallel with extension registration. It does
not use the older Go extension's startup checks; NEW_RELIC_IGNORE_EXTENSION_CHECKS
is therefore not an applicable optimization. Node agent v14.7.0 initializes before
the real ESM bundle. Memory/CPU contention and runtime SDK loading remain hypotheses
to measure, not reasons to disable monitoring or change production memory blindly.
Probe functions use a run-specific tailspend-beta-startup-690-<run-id>- prefix,
have no API integration, alias or provisioned concurrency, and are deployed through the existing CDK bootstrap roles and deleted with
their log groups in finally plus an unconditional authenticated workflow cleanup.
Reports expire after two days. Signed download URLs, credentials, raw logs and
environment dumps are never GitHub artifacts. Code/configuration use private
temporary files and the normal private CDK bootstrap assets/templates; these
assets follow the existing bootstrap retention policy. This workflow is an isolated
diagnostic, not part of normal promotion or integration tests.
Controlled results (21 October 2026)
Avoidable environment churn was found and fixed. Previously every deployment
used the moving GITHUB_SHA as TAILSPEND_RELEASE, changing every monitored
Lambda's environment even when only web, docs or CI changed. Configuration
updates can replace warm execution environments; the probe rounds also observed
fresh initialization after a round-only environment change. This increases cold
frequency independently of how long each initialization takes.
The stage workflow now resolves NEW_RELIC_SERVICE_RELEASE from the last commit
affecting service/schema/OpenAPI sources, Lambda bundling/monitoring inputs or
shared build/lock inputs. It checks out full Git history and fails rather than
using an unreliable shallow-history result. The history guard checks ancestors of the deployed
commit, so unrelated cached shallow PR refs do not block deployment on persistent
runners. CI runs the actual resolver after the same full-history checkout as deploy.
Unrelated source/docs merges retain
the same backend telemetry tag. Lock/build changes are conservatively treated as
backend-affecting. Frontend release IDs still use the full deployment commit;
local callers without the new variable retain the existing Git-SHA fallback.
The first adoption updates the release tag once. This avoids metadata-only
reconfiguration afterwards; it does not remove cold starts from real deployments
or otherwise guarantee warm environment retention.
Two completed experiments collected 42 verified cold starts, three per cell in each run, with the same deployed application bundles and New Relic layer. The second run additionally measured SDK evaluation. Init medians in milliseconds:
| Entry | Memory (MB) | Run 1 init | Run 2 init |
|---|---|---|---|
| App | 1024 | 1485 | 1873 |
| App | 1769 | 1884 | 1808 |
| Developer | 1024 | 1836 | 1446 |
| Developer | 1769 | 1809 | 1814 |
| Authorizer | 256 | 1519 | 1233 |
| Authorizer | 512 | 1507 | 912 |
| Authorizer | 1024 | 1584 | 1604 |
Memory is not a demonstrated repeatable cold-start fix. The authorizer's 256→512 MB comparison was almost unchanged in the first run and faster in the second. Core results also changed direction between runs. These small samples show substantial variation; they do not justify increasing production allocations. The synthetic warm handler does not measure real route work or its cost.
At the existing production allocations, the SDK-instrumented run recorded these component medians (ms; three samples each):
| Entry | Agent entry | SDK evaluation | Other application imports | Extension init |
|---|---|---|---|---|
| App, 1024 MB | 741 | 318 | 385 | 401 |
| Developer, 1024 MB | 634 | 243 | 253 | 281 |
| Authorizer, 256 MB | 621 | 219 | 58 | 289 |
SDK evaluation covers 33–34 runtime AWS SDK/Smithy CommonJS modules, with nested evaluations deduplicated. It is a subset of application import time, not an additional phase or a DynamoDB request. The runtime DynamoDB SDK was 3.1105.0 and the agent 14.7.0. SDK CPU time closely tracked its wall time. The agent's roughly 0.6–0.8 s startup and SDK evaluation explain substantial remaining work; the core bundles also spend roughly 0.25–0.4 s on other imports. No business handler or DynamoDB operation was invoked by these probes.
The retained profiles confirm native VM metrics are already disabled by the agent's serverless configuration. The dedicated ESM wrapper and slim layer are already in use. The extension's roughly 0.28–0.41 s initialization includes its licensing/setup path, so SSM cannot explain the entire 1.4–1.9 s initialization; the exact SSM network duration was not isolated. No monitoring feature was disabled to obtain these results. The pinned Rust extension is current, and the Node 14.8.0 release notes do not identify a cold-start fix to justify an unmeasured layer change for this issue.
The next code experiment should compare a tree-shaken SDK bundle against the same runtime SDK versions on ARM64, including artifact size and end-to-end cold-request latency. The earlier local SDK-bundling test used a different environment and found no consistent benefit; neither that result nor this decomposition proves a production win. Deferring imports into the first request would only move the same cost out of InitDuration.
The wider production REPORT comparison found the following cold-start counts and mean initialization times. Its before window covers the preceding day and its after window covers deployment+2 minutes through collection:
| Entry | Before requests / cold starts | Before mean init | After requests / cold starts | After mean init |
|---|---|---|---|---|
| App | 530 / 21 | 1563 ms | 421 / 4 | 1771 ms |
| Developer | 100 / 1 | 1741 ms | 100 / 1 | 1761 ms |
| Authorizer | 102 / 1 | 1704 ms | 102 / 2 | 1420 ms |
These are different traffic windows, and developer/authorizer cold samples are particularly sparse. They establish neither a stable p99 improvement nor a causal regression. The gateway's later rolling hour contained no data; retain the earlier post-deploy report as a separate observation rather than inventing an endpoint comparison.
New Relic NRQL confirmed the current production release's invocation telemetry
for all three core functions (421 app, 100 developer, 102 authorizer). A later
read-only query found 37 synthetic errors in AwsLambdaInvocationError with
the source-map verification attribute, confirming error delivery as well as
invocation delivery. Immediate per-run queries had initially returned zero;
allow for ingestion delay before treating that as a monitoring failure. The
final observer found 58 stored error stacks matching the fixed
startup-source.ts:2: TypeScript location, without exporting any stack traces
or request data. Counts increased as the existing probe telemetry finished
ingesting; no new business request was needed.
Raw measurements, sample counts, source hashes and workflow provenance are in
performance/api-startup-investigation-690.json.
The completed workflows removed their temporary stacks, functions and log groups.
Production memory, monitoring and concurrency remain unchanged by this investigation.
Post-deployment API integration jobs now upload an api-startup-<stage>-<attempt>
artifact (two-day retention). It contains aggregate CloudWatch REPORT statistics
for the hour before each function's last update and up to an hour after it, plus
timestamped API Gateway latency p95/p99 and request counts. Rollout and ingestion
margins are excluded. The report records the deployed release, memory allocation
and whether each core function has the New Relic wrapper, layer and account
configured. It does not change functions, monitoring or concurrency, and exports
no secrets, environment dumps or request logs. Diagnostic failures do not block promotion.
Run it with an existing AWS identity using
node scripts/api-startup-report.mjs <dev|beta|prod> report.json.
Short windows and sparse cold starts remain inconclusive; compare counts and
traffic composition before attributing a p99 change to this release. Configuration
checks do not prove that New Relic is ingesting events or mapping stack traces.
New Relic stays enabled with the pinned slim layer, ESM wrapper, request/error reporting and dependency spans. Provisioned concurrency is not used. The token authorizer remains uncached so revocation takes effect on the next request.
Two avoidable costs were found:
- Linked source maps embedded the full source of every bundled dependency.
ServiceLambdanow usessourcesContent: false, retaining the mappings and--enable-source-maps. A minified-bundle test deletes the original TypeScript file and still resolves the exception to its original line. Removing maps entirely would regress backend error reporting: New Relic's Node APM source mapping uses Node's runtime mapping; the existing Browser upload API is not a substitute. - The token authorizer imported the whole token-management service. That loaded API schemas, Zod locales and JSON-schema/compiler code before checking a token. Verification now has a shared, isolated module and a schema-free token-format export. Constant-time comparison, consistent reads, expiry/revocation checks, hourly LastUsedAt updates and fail-closed behavior are preserved. A real esbuild regression test rejects Zod/token-management imports and a bundle over 100 KB.
Local Node 24.19.0 / esbuild 0.28.2 measurements against 9a25a01 (nine fresh
processes per entry; decimal KB; JS plus linked map, before ZIP compression):
| Entry | JS before → after (KB) | Map before → after (KB) | Import median before → after (ms) |
|---|---|---|---|
| App core | 760.3 → 760.3 | 2,845.4 → 893.0 | 233.2 → 208.5 |
| Developer core | 670.8 → 670.9 | 2,554.5 → 765.2 | 219.2 → 207.1 |
| Token authorizer | 556.6 → 70.5 | 1,862.3 → 109.1 | 169.2 → 102.8 |
These isolate application imports: they exclude the Lambda platform, New Relic
agent/extension, network and invocation work. They are not production p99 or a
measurement of New Relic overhead. The raw report is in
performance/api-startup-690.json.
Bundling the AWS SDK was also tried; it increased package size and did not
consistently improve local imports, so SDK externalization is retained. The
existing dedicated ESM wrapper already avoids New Relic's documented legacy
NEW_RELIC_USE_ESM loader workaround; no loader or monitoring switch is added.
Reproduce the import/size probe without AWS calls or credentials:
npm run profile:api-startup --workspace=@repo/infra -- --samples 9
# Compare a dependency-installed checkout of the baseline using its old map policy:
node apps/infra/scripts/profile-api-startup.mjs --source-root /path/to/baseline --embedded-sources --samples 9
After normal deployment, re-measure with New Relic on in all compared releases. Query the three core/authorizer log groups over comparable traffic:
filter @type = "REPORT"
| stats count(*) as requests, count(@initDuration) as coldStarts,
    avg(@initDuration) as initAvgMs, pct(@initDuration, 95) as initP95Ms,
    pct(@initDuration, 99) as initP99Ms, pct(@duration, 99) as handlerP99Ms,
    pct(@billedDuration, 99) as billedP99Ms by @log
Compare API Gateway Latency/IntegrationLatency p95/p99 as well: a developer
request can pay authorizer and developer-core initialization in sequence.
Use New Relic's existing aws.lambda.coldStart dashboard and dependency spans
to distinguish initialization from first DynamoDB/SSM calls. The extension's
SSM license-key lookup, runtime SDK loading, CPU allocation and container
turnover remain possible contributors; no new production attribution is claimed
without current logs. This execution environment had no AWS/New Relic identity,
so live init/p99 validation remains a post-deployment check.
Resource Budget
- ServiceStack: the
api.<stage>domain plus the exceptional and background functions — well under 100 resources. - CoreApiStack: about 280 resources (including the unauthenticated
ANY404 mocks that make unknown routes answer404like the HTTP API did).
Both are well under the 500-resource limit.